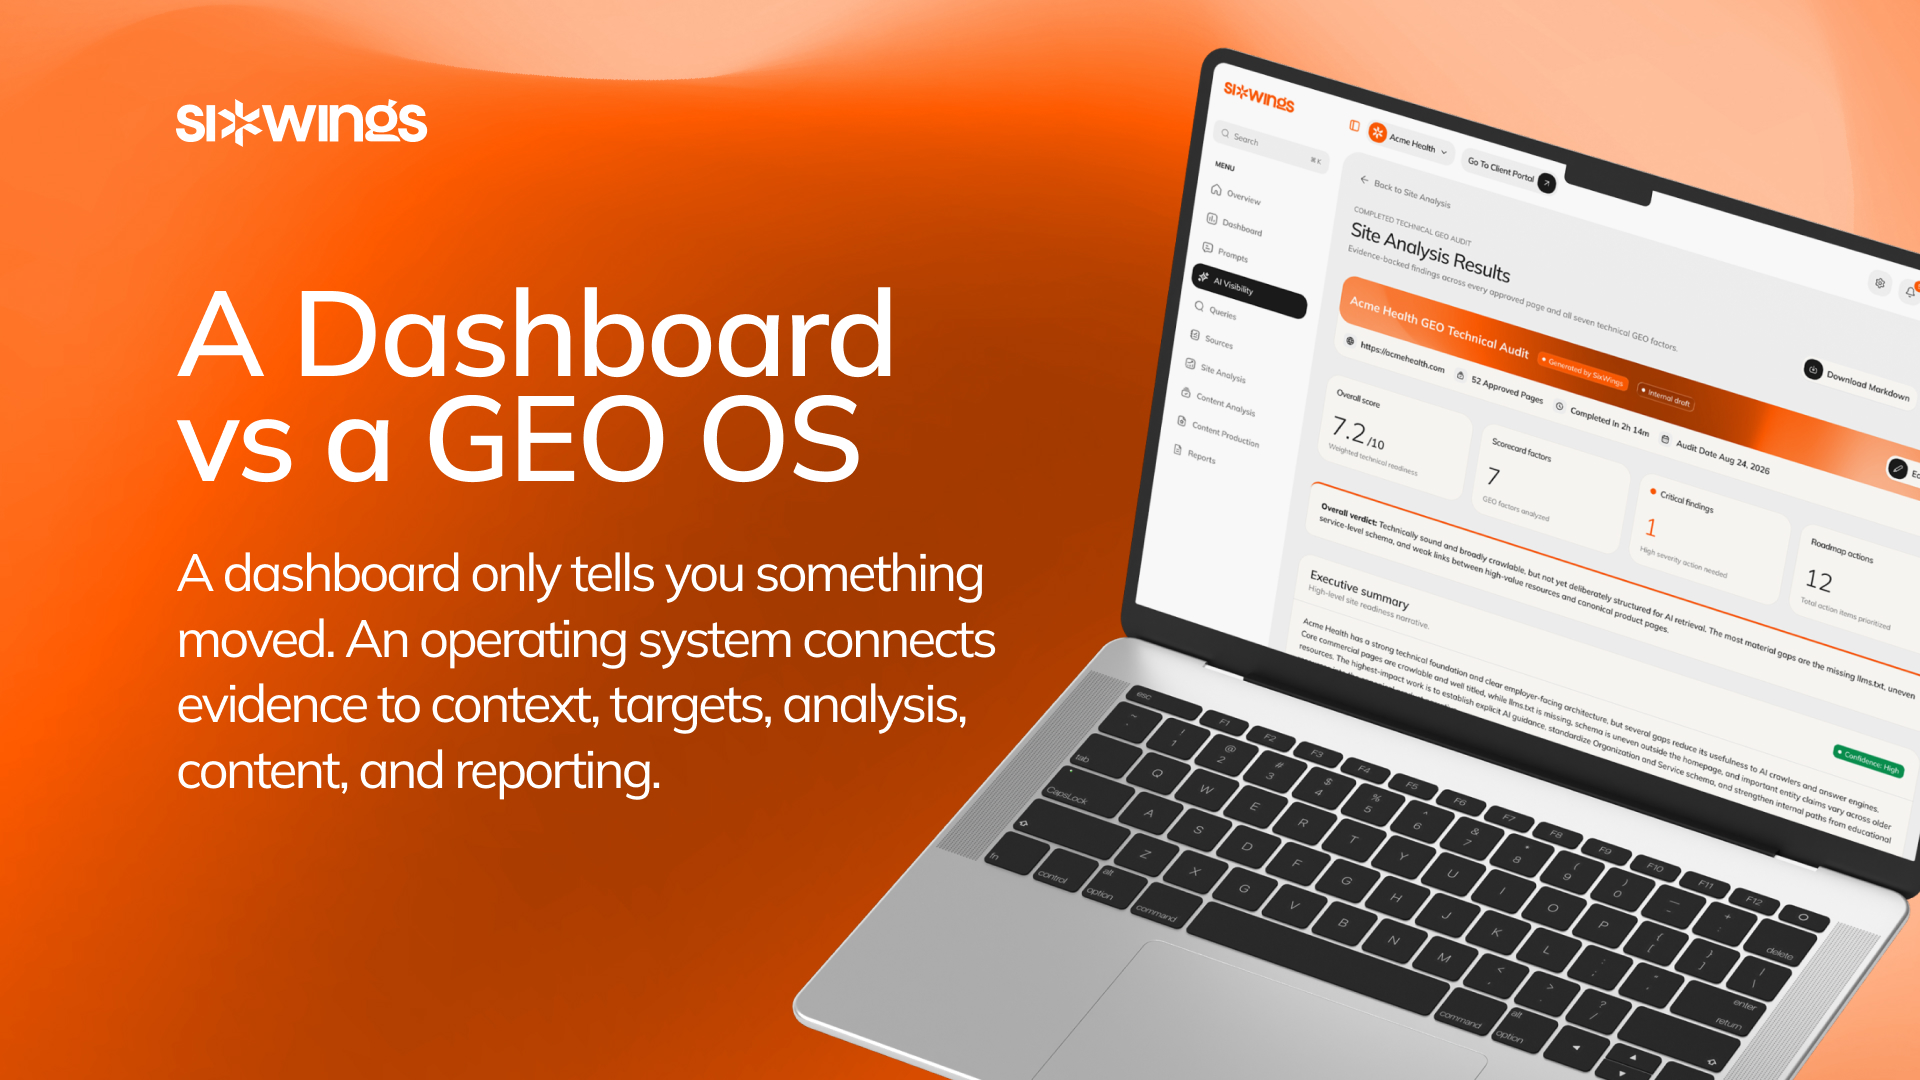
Most tools that promise to help with AI visibility are dashboards. They query a few AI engines, count how often a brand shows up, and render the result as a score with a trend line. That is useful. It is also where most of them stop.
Here is the difference in a sentence. A dashboard tells you something moved. An operating system connects the evidence to the brand's context, to the targets worth acting on, to the analysis of why, to the content work that responds, and to client-ready reporting, as one continuous chain. A dashboard is a gauge on the wall. An operating system runs the machine the gauge is measuring.
The distinction sounds like semantics until you try to act on a dashboard's number and discover there is nothing underneath it. This article lays out the difference directly, point by point: what a dashboard does, and what an operating system does instead. The gap between them is the most useful thing to understand before choosing where AI visibility work is going to live.
Contents
- The gap everyone runs into: from insight to action
- Measurement: a number vs the evidence beneath it
- Context: no memory vs one governed source of truth
- Direction: "here's the data" vs "here's what to do"
- Execution: a report vs the work itself
- Governance: an open tap vs approvals and roles
- Proof: a moving number vs a fixed record
- Why the difference compounds
- Where SixWings fits
- Frequently asked questions
The gap everyone runs into: from insight to action
There is one problem that shows up in nearly every honest review of GEO tools, and it has a name: the insights-to-action gap. It is the disconnect between seeing AI visibility data, the mention counts and the visibility scores, and knowing what to actually create or change to improve it. Across the category, it is the most widely discussed limitation.
The reason it is so common is that measuring AI visibility and improving it are two different jobs, and a dashboard only does the first. It can tell you that a brand appears in 20% of relevant answers. It cannot tell you which questions to target, which pages are feeding the wrong impression, or what to publish next. As one industry evaluation put it plainly: monitoring without action creates reports.
An operating system is defined by closing that gap. The clearest way people in the space describe a real platform is as the shortest reliable path from evidence to action, running a full loop: analytics, then opportunities, then actions, then validation. Everything below is a version of that same distinction, applied to one layer of the work at a time.
A quick note on the metaphor before the contrasts. Calling something an operating system is not about software for its own sake. It is about whether the thing coordinates the whole job or just displays one part of it. Keep that test in mind: does it show, or does it run.
Measurement: a number vs the evidence beneath it
What a dashboard does. It reports a visibility score. The brand appears in some percentage of answers, the number moved, here is the trend. The measurement is the product.
What an operating system does. It treats the number as the top of a stack of evidence, and keeps the stack. For every tracked question, it preserves the exact prompt, the provider's answer, whether the brand was mentioned, whether it was cited as a source, which competitors appeared, and which pages the model drew from. The score is just the summary of all that.
Why the difference matters is not abstract. A number with nothing beneath it cannot be explained, and it cannot be acted on. When the score moves and someone asks why, a dashboard has no answer. An operating system can show the specific answers and sources behind the movement.
There is a subtler reason the evidence layer matters, and the better GEO reviewers are candid about it. No dashboard can prove that one change caused a model's answer to shift, because nobody can freeze the model, the retrieval index, the competitor pages, and the wider web.
What a real platform can do is preserve the prompt, answer, source, and date before and after an action, so you can treat the movement as evidence rather than guesswork. That before-and-after record is only possible if the system kept the evidence in the first place. A dashboard that stored only the score has nothing to compare.
Context: no memory vs one governed source of truth
What a dashboard does. It runs queries and shows results. It does not know the brand. Ask it about a company and it measures whatever the models say, with no reference to what is actually true, what the brand is allowed to claim, or who its real competitors are.
What an operating system does. It starts from a governed record of the brand's own context: its facts, products, audiences, positioning, the approved claims, the claims it must never make, its tone, and its competitors. Every measurement and every downstream action is grounded in that record.
This is the difference between data storage and a system of record. A system of record is the authoritative source that every part of the work references, so nothing operates on a private, inconsistent version of the truth. A dashboard has no such layer. It is a viewer, not a source of record, which means the moment you want to produce anything from it, you are supplying the missing context by hand, every time.
The governed-context layer is what keeps a large body of work coherent. When the measurement, the prioritization, and any content produced all reference the same authoritative record, they stay aligned with what the brand has actually approved. Without it, each task drifts on its own, and the drift is invisible until something wrong ships.
Direction: "here's the data" vs "here's what to do"
What a dashboard does. It hands you the data and stops. The interpretation is your job. You get mention counts, a share-of-voice chart, maybe a list of prompts, and then a blank space where the decision should be. Pure monitoring tools consistently score lower in evaluations precisely because they leave this space empty.
What an operating system does. It does the prioritizing for you. It distills a large evidence set into a short, ranked list of what to act on: the questions, the pages, and the sources that matter most right now, ordered so the next move is obvious. It turns raw data into prioritized recommendations and, better still, into simple implementation briefs that describe the work to be done.
This is the heart of the insights-to-action gap, and it is where the "so what" question gets answered or does not. A dashboard raises the question and leaves it hanging. An operating system answers it, which is the entire point of measuring in the first place. The value is not in knowing you appear in 20% of answers. It is in knowing which five things to change to make that number move, and in what order.
The practical effect is a removal of labor and doubt. Instead of an analyst spending hours staring at a dashboard trying to reverse-engineer a plan, the plan arrives already shaped, drawn from the evidence. That is the difference between a tool that adds work and a tool that removes it.
Execution: a report vs the work itself
What a dashboard does. It produces a report and considers the job done. Whatever happens next, the content that gets written, the pages that get fixed, the technical changes that get made, happens somewhere else entirely, in other tools, disconnected from the data that motivated it.
What an operating system does. It carries the work through execution inside the same connected environment. From a prioritized opportunity, it supports producing the actual thing: a governed website article moving through research, a structured brief, drafting, and review, or a technical fix identified against a specific finding. The evidence that revealed the gap and the work that closes it live in one place.
This matters because the handoff between tools is where most GEO work quietly dies. The dashboard is in one system, the content in another, the brief in a doc, the approval in a chat thread. The connection between the finding and the fix is a human remembering to carry it across. An operating system keeps that connection intact, so a recommendation becomes owned work rather than a note that gets lost.
It also means the loop can actually close. After the work ships, the same system re-runs the questions and checks whether the answer, the citation, or the visibility changed. Analytics, opportunities, actions, validation, and back to analytics. A dashboard can only ever do the first step of that loop, over and over, without the three that give it meaning.
Governance: an open tap vs approvals and roles
What a dashboard does. It shows data to whoever has a login. There is little notion of who can change what, no approval gate before something goes live, and no record of who did what. That is fine when the only output is a chart. It stops being fine the moment real content or client-facing work is involved.
What an operating system does. It builds in the controls that make consequential work safe. Roles determine who can do what. Content passes through human approval before it ships, because AI-generated work lifts visibility only when it is accurate and on-brand, and an unreviewed claim can do real damage. Each approval applies to an exact version, so a later change does not silently inherit an old sign-off.
The distinction here mirrors a broader truth about business software: spreadsheets and shared drives are data storage without governance, not systems of record, because they cannot enforce what gets entered or route an approval or leave an audit trail. A GEO dashboard sits on the same side of that line. It stores and shows. It does not govern.
Governance is not bureaucratic overhead in this context. It is what lets the work be trusted, delegated, and run across many brands at once without something wrong slipping through. The moment AI visibility work moves from "interesting to look at" to "changes we publish in a brand's name," governance stops being optional.
Proof: a moving number vs a fixed record
What a dashboard does. It shows a live number that quietly rewrites itself. Last month's figure is gone, replaced by this month's. There is no stable record to point back to, which makes it almost impossible to demonstrate progress credibly, because the baseline keeps moving.
What an operating system does. It freezes a reporting period into a fixed, point-in-time snapshot. The number from March stays the March number even as April's data comes in, so a genuine before-and-after comparison is possible. Progress becomes provable rather than asserted.
This is the reporting equivalent of the evidence point made earlier. AI answers shift constantly, so a report that does not freeze its own baseline is measuring a moving target and calling the movement a trend. A snapshot pins the baseline. It is the difference between "trust me, it improved" and "here is March, here is April, here is exactly what changed."
For anyone reporting to a client or a leadership team, this is the layer that makes the whole discipline defensible. A moving number invites doubt. A fixed record, period over period, is what justifies continued investment.
Why the difference compounds
Any one of these gaps is survivable on its own. Together, they compound, and that is the real reason the distinction matters.
Consider what happens when the layers are missing in sequence. A dashboard shows a score with no evidence beneath it, so you cannot explain it. It has no brand context, so you cannot safely produce anything from it. It gives no direction, so you burn analyst time inventing a plan. It does not execute, so the plan crosses a gap into other tools and loses momentum. It does not govern, so what does get made is unreviewed. And it does not freeze a baseline, so you cannot even prove whether any of it worked. Each missing layer makes the next one harder.
Now consider the connected version, and notice it is a single chain. The evidence explains the score. The brand's context makes that evidence safe to act on. The targets turn it into a prioritized plan. The analysis explains why a page or answer performs as it does. The content work responds to that analysis. And client-ready reporting proves the result.
Each link feeds the next: evidence to context to targets to analysis to content work to reporting. That is what "operating system" actually means here. Not a bigger dashboard, but a chain where the output of each link becomes the input of the next, so nothing falls into the gap between one tool and another.
The selection principle that falls out of this is simple, and the sharper GEO analysts have arrived at the same one. The best platform is not the one with the largest dashboard. It is the one that gives a team the shortest reliable path from evidence to action. A dashboard is where that path begins. An operating system is the whole path.
None of this makes dashboards useless. A gauge is genuinely useful. The mistake is expecting a gauge to run the engine. If the goal is only to watch AI visibility, a dashboard is enough. If the goal is to change it, reliably and repeatedly, the work needs the layers a dashboard does not have.
Where SixWings fits
SixWings pioneered the Answer Experience Design model and built the platform that runs it, and "operating system" is the honest description of what that platform is.
In plain terms, SixWings is a fully white-labelled GEO operating system. It measures how a brand shows up in AI answers, turns that raw data into prioritized recommendations and simple implementation briefs, and hands those to whoever executes, an in-house team or an external one, so the work is easy to act on. Think of it as an SEO toolkit, but for the AI-answer layer instead of Google rankings, and built to run the work rather than just watch it.
Mapped to the six contrasts above, that means:
- Measurement with evidence. It keeps the full record behind each answer across supported providers (currently OpenAI, Anthropic, Gemini, Perplexity, and Grok): the question, the response, mentions, citations, competitors, and the sources the models drew from.
- A governed source of truth. Each brand's space starts from a governed record of its facts, approved claims, guardrails, and competitors, which grounds everything downstream.
- Direction, not just data. SixWings does the prioritizing for you, distilling the evidence into the short list of questions, pages, and sources that matter most. That removes the decision fatigue and the hours normally lost to figuring it out.
- Execution in the same place. It carries work through to governed website-article production and technical site audits, connected to the evidence that revealed the need.
- Real governance. Defined roles per workspace and mandatory human approval on content before anything goes live.
- Provable results. A reporting period freezes into a fixed, point-in-time snapshot, shared through a custom-branded portal, so progress is demonstrable and client-ready.
The point is not that SixWings has a nicer dashboard. It is that a dashboard and an operating system are different categories of thing, and the work of actually changing AI visibility needs the second one.
Frequently asked questions
Isn't a dashboard enough to track AI visibility? For watching, yes. A dashboard tells you how visible a brand is, which is a real and useful thing. The limit is that it stops at measurement. The moment you want to explain a change, decide what to do, produce the fix, or prove the result, you need the layers a dashboard does not have.
What actually makes something a "GEO operating system" rather than a dashboard? A connected chain. A dashboard tells you something moved. An operating system connects the evidence to the brand's context, to the targets worth acting on, to the analysis of why, to the content work that responds, and to client-ready reporting, so each link feeds the next. The test is whether it runs the whole workflow or just displays one part of it.
What is the "insights-to-action gap"? It is the disconnect between seeing AI visibility data and knowing what to change to improve it. It is the most commonly cited limitation of monitoring-only tools, which show what is happening without telling you what to do about it. Closing that gap is essentially what separates an operating system from a dashboard.
Can any tool prove that a change caused an AI answer to improve? No, and a credible platform is honest about that. Nobody can freeze the AI model, the retrieval index, competitor pages, and the wider web. What a real system can do is preserve the prompt, answer, source, and date before and after a change, so movement can be treated as evidence rather than proof. A dashboard that stored only a score cannot even do that.
Which AI engines should a GEO operating system cover? The major generative answer surfaces buyers use today, including ChatGPT, Google's AI Overviews and Gemini, Perplexity, and Claude. Because each behaves differently and pulls from different sources, results should be kept and reported per provider rather than blended into one universal number.